Lighthouse - An Overview
What is Lighthouse

Overview
Lighthouse is an open-source, automated tool for improving the quality of web pages. You can run it against any web page, public or requiring authentication. It has audits for performance, accessibility, progressive web apps, and more.
Why it’s Useful
Running reports on an application gives us insight into issues early on without us having to scan through our application each time. Lighthouse can be ran manually in Devtools but also via the CLI or programmatically as discussed further down so generating these reports can also be automated.
With this information and tooling it could be possible to see issues at the point they come in such as a commit that ruins performance or adds a bad practice which could easily be missed by a code review.
Generating Reports
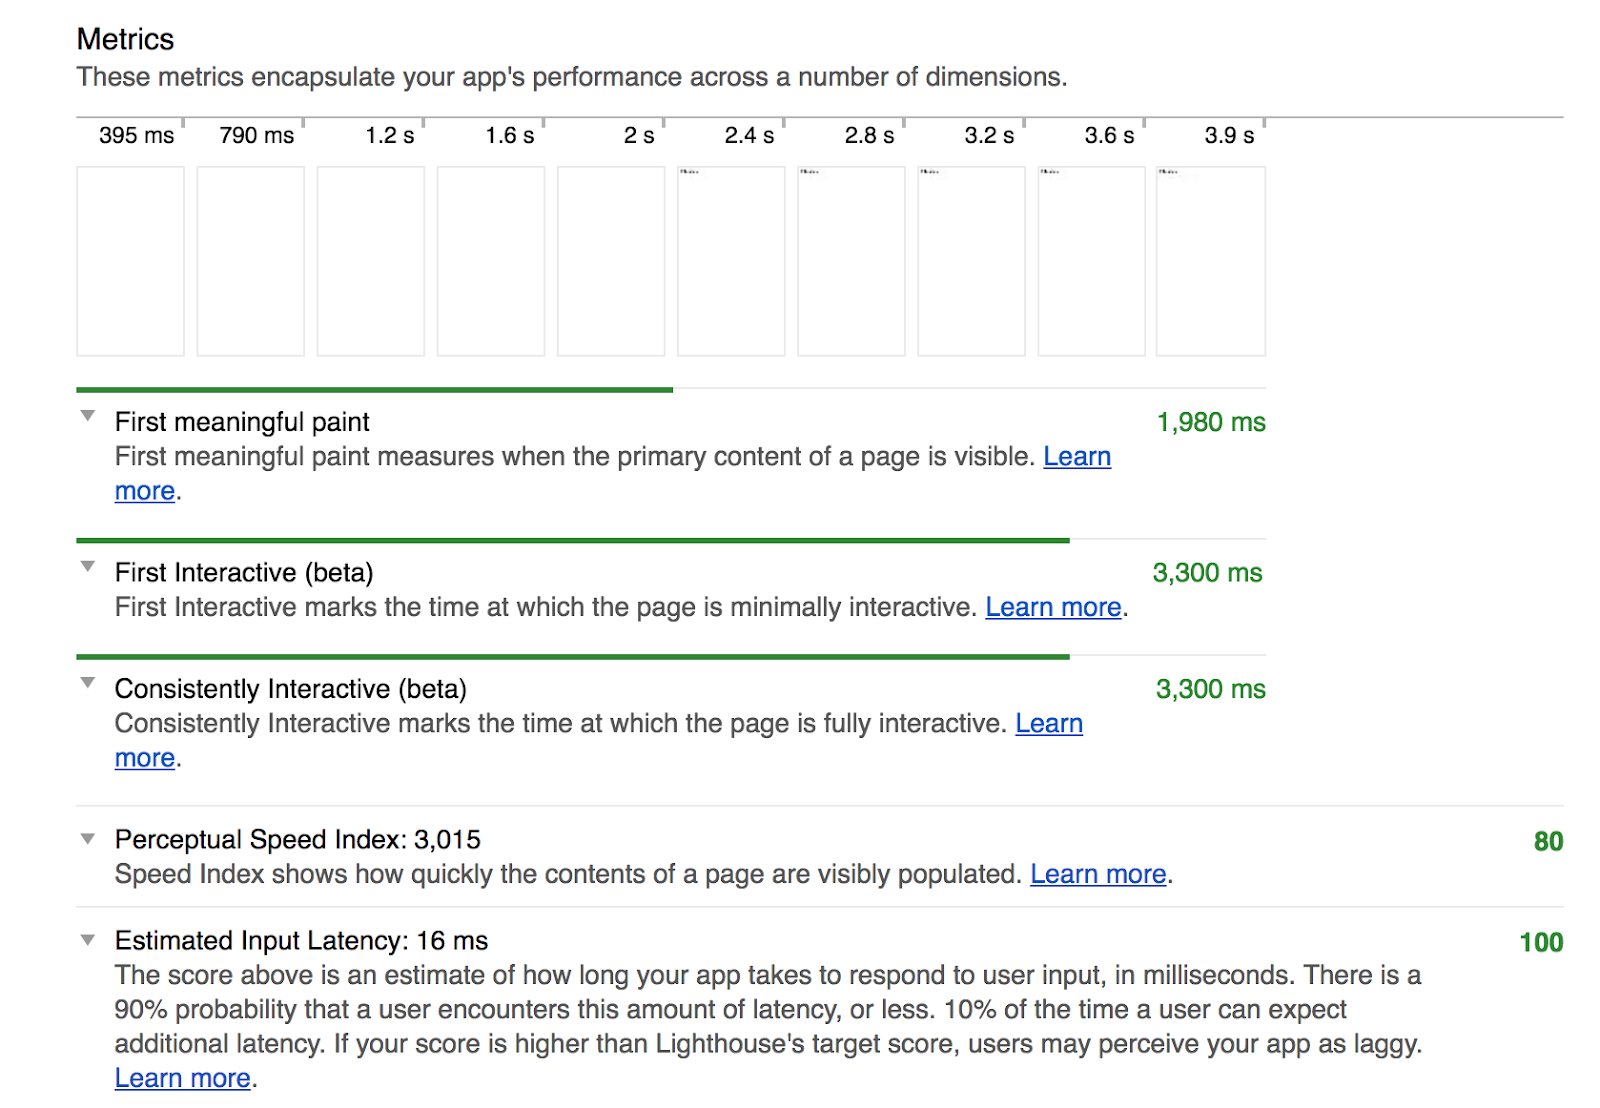
Resulting Reports
Reports can be output via HTML or json so you can parse and inspect the data programmatically. At the time of writing by default you’ll get 4 categories (Progressive Web App, Performance, Accessibility and Best Practices) each with multiple audits that either pass or fail.

Some of the pass fail boundaries are pre configured by lighthouse so may not totally apply to your applications. For example performance tests will determine if your application loads quickly, however you may have different speeds in mind for what lighthouse determines is fast or not. Also lighthouse tries to guess when your application is ready to interact with but you may notice that this guess is incorrect. To solve these issues I'll talk about creating custom reports later where you will gain much more control over a report.
How to Run
There are three ways to run lighthouse each documented on the lighthouse documentation pages.
- Chrome Devtools - https://developers.google.com/web/tools/lighthouse/#devtools
- CLI - https://developers.google.com/web/tools/lighthouse/#cli
- NodeJS - https://developers.google.com/web/tools/lighthouse/#programmatic
The last two will allow you to run reports with finer grain config and/or with custom reports which is up next.
How it Works
Lighthouse is essentially a bunch of node code that interfaces with the chrome dev tools via the devtools protocol.
There are 3 different things the first being "gatherers". Gathers are things that collect information from the page. Gatherers run on passed as lighthouse will refresh the page multiple times to gather different information. Passes could be for example a pass offline to check the application runs offline.
When gatherers are done they return artefact handed off to an audit. This is a pass of fail check or something that applies scoring.
This hands off JSON of the audit data into report generation which is simply categorising these audits which gives us the report.

Configuring Reports
When running the tests it may be the case that you don’t care about certain audits. If you’re not building a progressive web application then there's no need to run that entire category or at a finer grain you can skip certain audits within a category.
To do this you can pass a custom config such as the example below shows using the CLI with a config file my-conf.js.
lighthouse --config-path=my-config.js http://localhost:9001 --view
The --config-path argument takes a relative path to a js module or json config file. For some examples see the lighthouse config examples on github.
In these configs you can include or remove gatherers on passes, audits and categories. Note if you remove something make sure it's not referenced somewhere else e.g. if you remove an audit make sure no category then uses that audit.
Creating Custom Reports
Lighthouse allows you to write custom reports by creating your own gatherers and audits. These can then be included in the config in existing categories or new ones if you wish.

The details on how to do that will be left for another post.
Reporting on Authenticated Pages
Because lighthouse interfaces with chrome dev tools you can navigate to pages that require authentication via the devtools.
First login to the application using the chrome browser.
Next you’ll need to to get your devtools port so you can pass it to the lighthouse cli command. To do this run "chrome-debug".

Then use the port number returned when running lighthouse as the --port argument.
lighthouse --config-path=my-config.js http://localhost:9001 --port 59020 --view
There’s a bit of a manual setup there having to login via chrome first but once again in another post I'll try and see if we can automate this too.


Comments
Post a Comment